
OR
(The Importance of Workload Testing When Upgrading to SQL Server 2014)
Improving HammerDB Performance with the New 2014 Cardinality Estimator
- Part 1: HammerDB and the New SQL Server 2014 Cardinality Estimator
- Part 2: Use the Query Store In SQL Server 2016 To Improve HammerDB Performance
With SQL Server 2014 comes a brand spankin’ new cardinality estimator. Here is an excerpt from the summary of the whitepaper titled “Optimizing Your Query Plans with the SQL Server 2014 Cardinality Estimator” by Joe Sack:
“SQL Server 2014 introduces the first major redesign of the SQL Server Query Optimizer cardinality estimation process since version 7.0. The goal for the redesign was to improve accuracy, consistency and supportability of key areas within the cardinality estimation process, ultimately affecting average query execution plan quality and associated workload performance. “
Sounds fancy, huh? So I decided to play around and compare a HammerDB TPC-C workload played against a 2012 database versus that same workload against a 2014 version of that database. For those that do not know, HammerDB is a free open-source benchmarking tool that can be used on a variety of RDBMSs.
For this scenario, let’s pretend that our application (HammerDB) currently uses a SQL Server 2012 database on the backend. We have just been approved to upgrade to SQL Server 2014, and we want to make sure that after the upgrade our application will perform at least at the same level as it did while on the 2012 database. Generally speaking, users are not happy if an upgrade causes a performance degradation. =)
Surely HammerDB will perform better with the new and improved 2014 Cardinality Estimator (CE), right? Let’s see.
The Setup Process
1. I began by using HammerDB (v2.16) to create a new TPC-C database called ‘tpcc’ with 10 Virtual Warehouses on my local 2012 instance. The result is a small 1GB database with both the data and log files on my C: drive. (Note: I am using the Original schema to build the database. I have not tested with the Updated schema and results could very well be different.)
2. Next, I took a backup of the tpcc database. This allowed me to use the same starting database for each test, without having to use HammerDB to rebuild it.
BACKUP DATABASE [tpcc] TO DISK = N'C:\2012INSTANCES\tpcc_blogtesting_10WH.bak';
3. I restored the tpcc database to my new 2014 instance and ran some necessary upgrade commands:
/* Using this blog post from Thomas LaRock as a guideline for upgrading to 2014:Upgrading to SQL Server 2014: A Dozen Things to Check*/ USE [master] GO --Both data and log file on my C drive - not being fancy here RESTORE DATABASE [tpcc] FROM DISK = N'C:\2012INSTANCES\tpcc_blogtesting_10WH.bak' WITH FILE = 1 ,MOVE N'tpcc' TO N'C:\2014INSTANCES\DATA\tpcc.mdf' ,MOVE N'tpcc_log' TO N'C:\2014INSTANCES\LOGS\tpcc_log.ldf' ,NOUNLOAD ,STATS = 5 GO --Be sure to set the database compatibililty_level up to the newest version! ALTER DATABASE [tpcc] SET COMPATIBILITY_LEVEL = 120; USE [tpcc] GO DBCC CHECKDB WITH DATA_PURITY; DBCC UPDATEUSAGE(tpcc); USE [tpcc] GO EXEC sp_MSforeachtable @command1='UPDATE STATISTICS ? WITH FULLSCAN';
4. Now that the database was ready to go on both my local 2012 instance and on my local 2014 instance, it was time to prepare the workload driver options on HammerDB. I used a timed test with 1 Minute of Rampup Time and 3 minutes for the Test Duration. The Virtual User Options can be seen below:

5. Time to setup PerfMon. I used PerfMon to capture ‘Batches Requests/Sec’ (separate counter for each instance) and CPU Usage. These two metrics give a good enough idea of how the workload is performing. I set the Scale for ‘% Processor Time’ to 10.0 to make it easier to view compared to Batch Requests/sec.
![]()
The Workloads
Now that the setup is complete, it’s time to run the HammerDB workloads. Here are the results and PerfMon charts:
2012 (Performance Baseline):
In our scenario, this is how our application performs pre-upgrade. This is the performance baseline. After upgrading to 2014, these are the numbers we want to try to hit.
HammerDB Results: 114,901 Transactions Per Minute (TPM); 25,035 New Orders Per Minute (NOPM)
CPU Average: 35%; Batch Requests / Sec average: ~1,750

2012 PerfMon Chart
2014 (Workload after the upgrade):
Let’s point the application at the upgraded 2014 database and see what happens!
HammerDB Results: 31,542 Transactions Per Minute; 6,894 New Orders Per Minute
CPU Average: 74%; Batch Requests / Sec average: ~ 492

2014 PerfMon Chart
Uh Oh! After the upgrade our CPU Utilization has more than doubled and our application throughput has decreased by over 70%! If this were in production, users would be looking for heads to roll.
Let’s take a look at the performance numbers side-by-side:
| Workload | TPM | NOPM | %CPU Avg | BatchRequests/Sec Avg |
| 2012 | 114,901 | 25,035 | 35% | 1,750 |
| 2014 | 31,542 | 6,894 | 74% | 492 |
What gives?! I thought 2014 was supposed to improve performance?! Well, let’s see if we can figure out what happened.
What Happened?
Because CPU usage was so different between the two workloads, the first thing I decided to do was to query sys.dm_exec_query_stats and compare query statistics based on which queries used the most CPU time (total_worker_time).
SELECT TOP 15 SUBSTRING(qt.TEXT, (qs.statement_start_offset / 2) + 1, (
(
CASE qs.statement_end_offset
WHEN - 1
THEN DATALENGTH(qt.TEXT)
ELSE qs.statement_end_offset
END - qs.statement_start_offset
) / 2
) + 1) AS 'QueryText'
,qs.total_logical_reads / qs.execution_count AS AvgLogicalReads
,qs.total_worker_time / qs.execution_count AS 'AvgWorkerTime(µs)'
,qs.total_worker_time AS 'total_worker_time(µs)'
,qp.query_plan
FROM sys.dm_exec_query_stats qs
CROSS APPLY sys.dm_exec_sql_text(qs.sql_handle) qt
CROSS APPLY sys.dm_exec_query_plan(qs.plan_handle) qp
WHERE qt.TEXT NOT LIKE '%sys.dm%' --filter out dmv queries
ORDER BY qs.total_worker_time DESC -- CPU time
OPTION(RECOMPILE)
Here are the results from the query on both instances (2012 on the left, 2014 on the right):
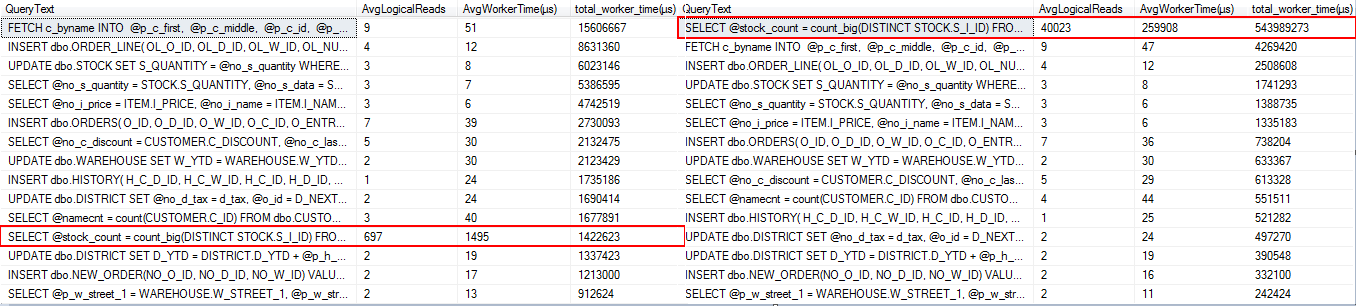
2012 Results 2014 Results
Right away, the query using the most total CPU on the 2014 instance jumps out at us. You can see the difference between the query on the 2012 instance and the 2014 instance. But why is the query behaving differently? Let’s check the execution plans.
The query (formatted for readability):
SELECT @stock_count = count_big(DISTINCT STOCK.S_I_ID)
FROM dbo.ORDER_LINE
 ,dbo.STOCK
WHERE ORDER_LINE.OL_W_ID = @st_w_id
 AND ORDER_LINE.OL_D_ID = @st_d_id
 AND (ORDER_LINE.OL_O_ID < @st_o_id)  AND ORDER_LINE.OL_O_ID >= (@st_o_id - 20)
 AND STOCK.S_W_ID = @st_w_id
 AND STOCK.S_I_ID = ORDER_LINE.OL_I_ID
 AND STOCK.S_QUANTITY < @threshold
 So, the query went from doing an Index Seek + a RID lookup on the STOCK table in 2012, to a parallelized table scan (with a missing index hint) in 2014.
The Fix
Luckily for us, the problematic query belongs to a stored procedure created by HammerDB called SLEV. This means it will be pretty easy to modify the query since we can directly edit the stored procedure on the database.
SQL Server 2014 introduces a brand new trace flag to assist in reverting to the legacy Cardinality Estimator. Here is another quote from the whitepaper mentioned earlier by Joe Sack:
“Trace Flag 9481 reverts query compilation and execution to the pre-SQL Server 2014 legacy CE behavior for a specific statement.”
So, we can use Trace Flag 9481 to bring back the old CE. This trace flag can be enabled globally, or at the individual query level. This allows us to fine tune certain queries where performance may have degraded since the upgrade, without affecting queries that may have actually improved with the upgrade.
We can place “OPTION QUERYTRACEON(9481)” at the end of the problem query inside the stored procedure to revert just that query to the old version. Hopefully this will get our HammerDB workload back to acceptable performance levels.
CREATE PROCEDURE [dbo].[SLEV] @st_w_id INT
	,@st_d_id INT
	,@threshold INT
AS
BEGIN
	DECLARE @st_o_id INT
		,@stock_count INT

	BEGIN TRANSACTION

	BEGIN TRY
		SELECT @st_o_id = DISTRICT.D_NEXT_O_ID
		FROM dbo.DISTRICT
		WHERE DISTRICT.D_W_ID = @st_w_id
			AND DISTRICT.D_ID = @st_d_id

		SELECT @stock_count = count_big(DISTINCT STOCK.S_I_ID)
		FROM dbo.ORDER_LINE
			,dbo.STOCK
		WHERE ORDER_LINE.OL_W_ID = @st_w_id
			AND ORDER_LINE.OL_D_ID = @st_d_id
			AND (ORDER_LINE.OL_O_ID < @st_o_id) AND ORDER_LINE.OL_O_ID >= (@st_o_id - 20)
			AND STOCK.S_W_ID = @st_w_id
			AND STOCK.S_I_ID = ORDER_LINE.OL_I_ID
			AND STOCK.S_QUANTITY < @threshold OPTION (QUERYTRACEON 9481) --*****ADD THIS OPTION TO REVERT QUERY TO LEGACY CE*****

SELECT @st_o_id AS N'@st_o_id' ,@stock_count AS N'@stock_count'
END TRY
BEGIN CATCH
SELECT ERROR_NUMBER() AS ErrorNumber
,ERROR_SEVERITY() AS ErrorSeverity
,ERROR_STATE() AS ErrorState
,ERROR_PROCEDURE() AS ErrorProcedure
,ERROR_LINE() AS ErrorLine
,ERROR_MESSAGE() AS ErrorMessage;
IF @@TRANCOUNT > 0
			ROLLBACK TRANSACTION;
	END CATCH;

	IF @@TRANCOUNT > 0
		COMMIT TRANSACTION;
END
GO
Now that the trace flag is in the stored procedure, let’s fire HammerDB back up.

2014 Workload with TF 9481 on problem query

BOOM! HammerDB throughput is back up to the same level it was at before the upgrade, CPU on my laptop is back in the 35% range, and the query’s statistics are back to the legacy CE levels. End users are rejoicing!
Conclusion
I’ve simply shown one way to fix the problem query in HammerDB. There are other ways this could have been handled, but the trace flag Microsoft introduced makes it very easy to quickly revert queries to the legacy CE to ‘fix’ performance.
It is very important to always test applications, workloads, or queries before fully upgrading to SQL Server 2014. To make the upgrade process easier on yourself, take some time to get to know your workloads (application throughput, query performance, etc.) before the upgrade ever takes place. With a good baseline for reference, it makes it much easier to compare performance post-upgrade. A single bad query can bring the entire application to its knees. The new Cardinality Estimator will most likely do much more good than bad for queries, but there will always be edge cases where performance declines.

Thanks for this analysis!
Part of our 2014 migration project I started using HammerDB to compare the new SQL 2014 envrionment with our existing 2008 R2 environment and found the same performance issues with 2014 that you have highlighted. I initially suspected that the new cardinality estimator had something do with it but haven’t had the chance to dig into this.
Great example of what to look for when considering to use the new CE.
I think this blog post hits another great point. DBAs shouldn’t be using tools like HammerDB to see if their applications databases should be upgraded. This is not your applications workload it’s a specific benchmark. Distributed Replay or other workload replay tools should be used to replay your applications workload so you would know how new functionality impacts your application not a specific benchmark.
Thanks! I wanted to see if you had experience with a related problem. We are using HammerDB to test a pre-prod SQL Server 2014 (compat 2008 so old CE). Runs fine mostly except for (a) occasional dips in TPM and (b) very rare sustained, degraded TPM. We have noticed increased index searches/sec exactly aligned to degraded TPM. Any ideas?
Hmm interesting. How long do the dips in TPM typically last? If the dips last long enough, you might try running a sp_WhoIsActive or something similar during one of the dips to see if you catch anything long running.
Have you checked the plan cache to see if any queries stick out? You might try looking for both max_worker_time and max_elapsed_time to the plan cache query to see if anything obvious sticks out.
Brilliant! sp_WhoIsActive was perfect
Two kinds of issues we are chasing. (a) Short dip and (b) Sustained and drastic degradation.
(b) occurred and is when I ran sp_WhoIsActive and traced it back to SLEV sproc. This is hugh progress. Can’t thank you enough! But I am fighting Medusa. One answer = 2 problems
1. Why does this occur randomly? And for varying durations. I would think HammerDB sends a steady flow of SLEV requests. We run fine for an hour then this hits for 15-20 minutes, then back to good.
2. Is there some underlying config problem with our instance, or is it a HammerDB oddity?
If you have any insight, it is much appreciated.
Thanks already for all your help.
I can’t speak to any possible config issues with your instance.
It sounds to me like the SLEV stored procedure might be getting recompiled along the way, and the plan it is getting compiled for is not optimal for all parameters (i.e. parameter sniffing). Can you keep track of the execution stats for the stored proc while it is running?
You might want to look at the execution plan for SLEV while it is running well, and then compare the plan SLEV is using when it starts performing poorly.
Yes. Drop in batches/sec exactly aligns to increased (a) index searches/sec and (b) recompiles/sec —- for the span of ~15 minutes. Then after that all is good again. Digging in now to understand why we would have repeated re-compiles for 15 minutes then none.
Again, many thanks!
Not a problem! Good luck.